
Quantities & reports
Graphical quantity surveying
The graphical quantity surveying in ELITECAD is based on a database and is set in relation to the model. Quantity data is bidirectionally linked to the model and represented graphically in the model.
You can use your building model as a central source of information and obtain comprehensive sustainability data with minimal effort. You can use the transparent calculations as evidence for certifications, to make you fit for the circular economy or to support the financing of your project. Instead of wasting time on time-consuming manual processes, you can focus on creative design while ELITECAD Architecture helps you fulfil and document your project's sustainability claim.

By selecting one element in the model the related value will be displayed highlighted in the database. If you choose the value in the database in return, the related element in the model will be highlighted. For this reason an optimum overview and plausibility of the evaluated objects is reached and at the same time there is a good visual control.
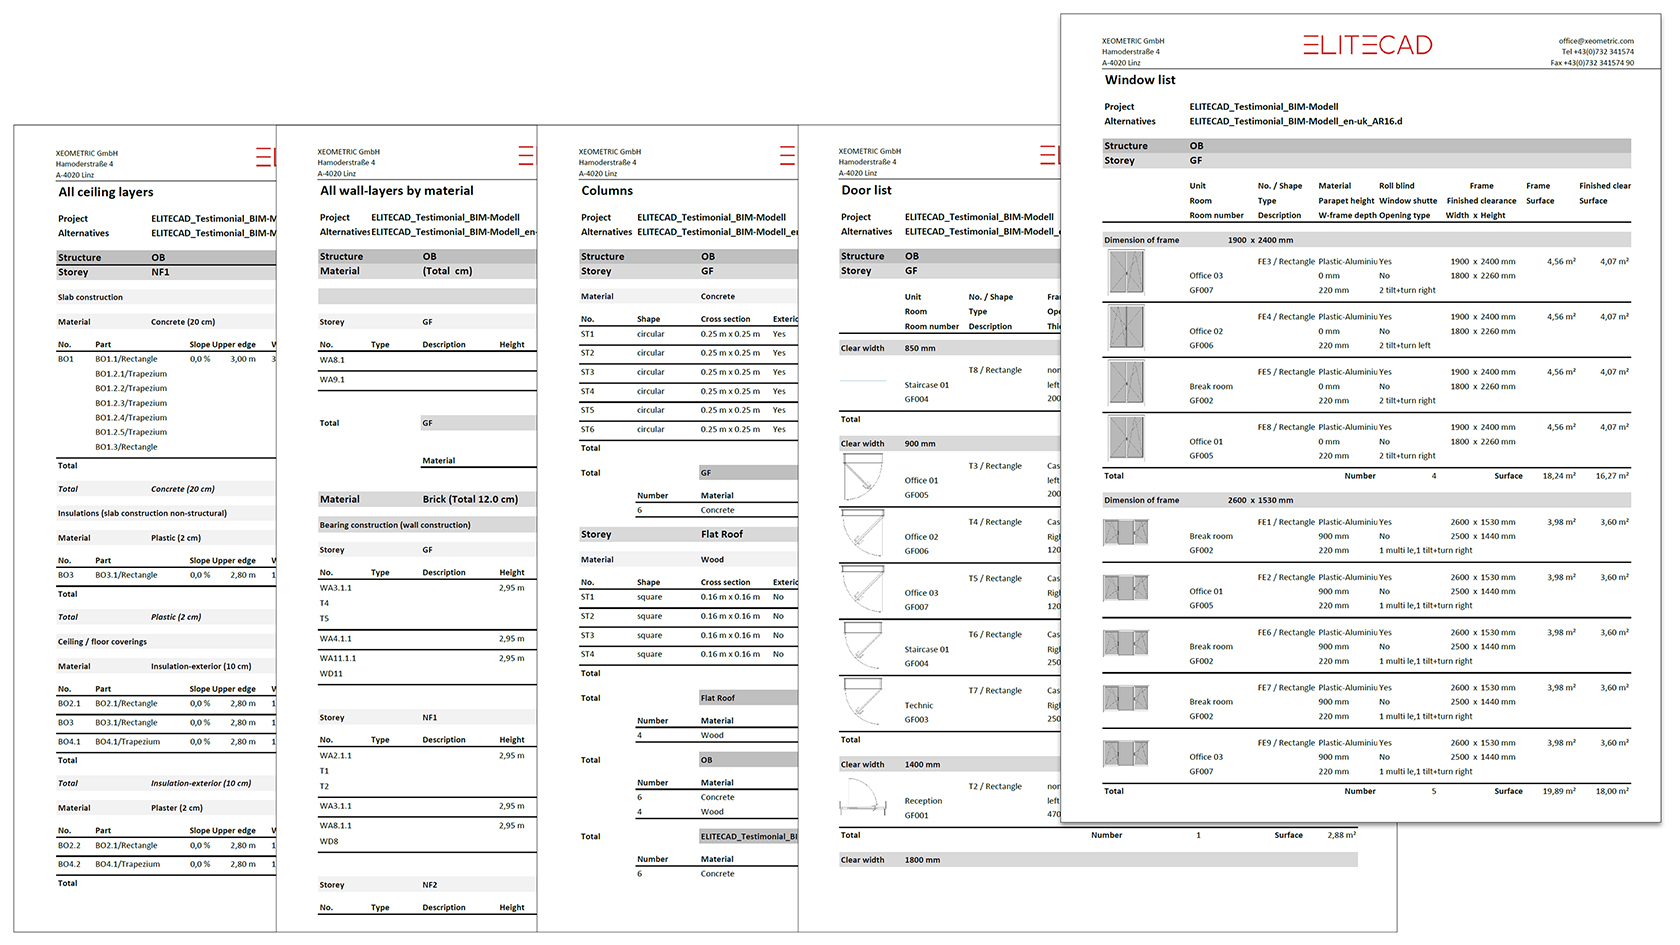
Reports with illustrations
Quantity surveying reports are structured logically, have flexible layouts based on Microsoft Excel and optional graphical depictions of doors and windows.
Automatically generated analysis reports with clear diagrams allow you to easily understand and present complex data. Whether pie charts for material distributions or bar charts for energy efficiency – every visualisation gets to the heart of your planning at a glance. With the prepared sustainability reports in ELITECAD, for example, you can easily determine the CO₂ impact of the construction of a new building. You can also analyse the consumption of non-renewable energy for renovation projects or other construction phases. Or you can use the building resource pass for detailed information on the quantities of materials used in terms of material requirements and recyclability, so you always have all the relevant values for sustainable decisions at your fingertips.
Gross volume
The gross-volume of rooms is an important foundation for the calculation of costs for a building. ELITECAD automatically calculates this information according to the local standard based on the gross ground area and the corresponding heights. The graphical depiction is the ideal tool for verification of the calculation. Either the entire room or the selected section can be highlighted based on the formulas and the partial areas.
The calculated areas are shown as new elements in the quantity manager, so that the corresponding areas can be easily filtered and highlighted, for instance per storey or category. The corresponding data is listed for the individual objects. Every partial area is depicted with formula and result. The generated data can also be grouped together into a report for the gross-volume of rooms.
Automatic calculations, easy verification
In addition to standard-dependent global master data, you can optionally also manage project- and region-specific master data and thus receive early information about compliance with or exceeding official limit values and specifications, such as the maximum area to be built on or the height of the construction project. Technical details such as reveal areas for windows and doors are also automatically calculated and clearly displayed – ideal for coordination with the trades. Even complex components, free-form shapes or special materials can be seamlessly integrated. This allows you to keep an eye on all relevant parameters and make informed decisions – even for demanding projects.